
Q&A - Analytical Platform
Q: What method are you using to analyze HMOs?
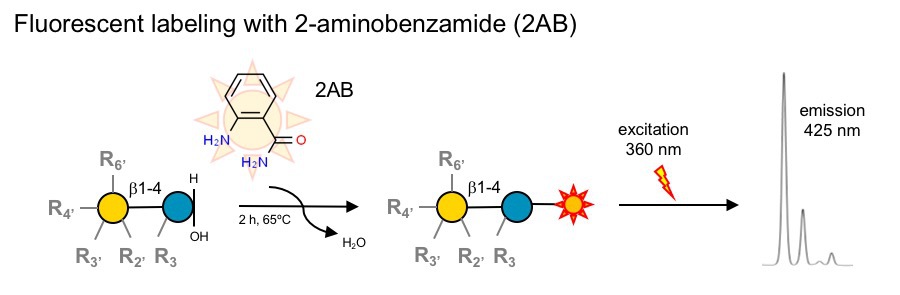
A: We use high-throughput parallel solid phase extraction to isolate HMOs from human milk, then label them with the fluorophore 2-aminobenzamide (2AB) and analyze them by high- and ultra-high-pressure liquid chromatography (HPLC/UPLC) over an amide column coupled with online fluorescence detection (HPLC-FL).
Q: Why are you using HPLC/UPLC instead of mass spectrometry?
A: HPLC is a separation technique, mass spectrometry is a detection system. In fact, many mass spectrometry methods also use HPLC/UPLC as separation technique prior to mass spectrometric detection (LC-MS). Our fluorescence detection system with 2-aminobenzamide (2AB) is highly sensistive (low pmol range), which allows us to reliably quantify HMOs in as little as 1/5,000 uL (0.2 nL!) human milk and very low volumes of other liquids or tissues, including plasma, urine or amniotic fluid. In contrast, many mass spectrometric detection systems have difficulties providing reliable absolute quantification.
Q: Do you not use mass spectrometry at all?
A: Yes, we do use mass spectrometry as well, but not coupled to our routine HMO analytical platfrom. That's simply not necessary. However, we work very closely with UC San Diego's GlycoAnalytics Core, which is just one floor below our lab, where we use mass spectrometry for detailed structure elucidation. For example, that's how we identified the structure of disialyllacto-N-tetraose (DSLNT) as the protective HMO against necrotizing enterocolitisn (NEC) [Jantscher-Krenn E. et al. Gut 2012; 61(10):1417-25 - PubMed]
Q: More than 150 different HMOs have been identified, but you are currently only measuring 20. Why is that?
A: While we can detect many more HMOs, we don't feel comfortable providing absolute quantification for more than the current 20 HMOs. Absolute quantification in any method relies on the availability of clearly defined standards (pure HMOs at known concentrations) to establish response factors. In other words, we need to know how the signal we measure for each HMO translates to absolute concentrations. That response factor is different for different HMOs. If we don't have the standard to establish a standard curve and response factor, we cannot provide reliable quantification for that HMO. - That's not just a limitation for our method, but a limitation for the entire field.
Q: How well do these 20 HMOs capture the entire HMO chemical space?
A: The 20 HMOs we can measure today are the major HMOs by concentration, adding up to about 95% of the total concentration of HMOs in human milk. In aother words, the other HMOs that we can't quantify today make up only about 5% of all HMOs by total concentration. Most importantly, the 20 HMOs we can reliably quantify today contain all known structural features, including type 1 and type 2 elongation, branching, alpha-1-2,3,4-fucosylation, alpha-2-3,6-sialylation as well as terminal and internal fucosylation/sialylation, covering a vast part of, if not the entire HMO chemical space.
Q: How can you provide absolute quantification?
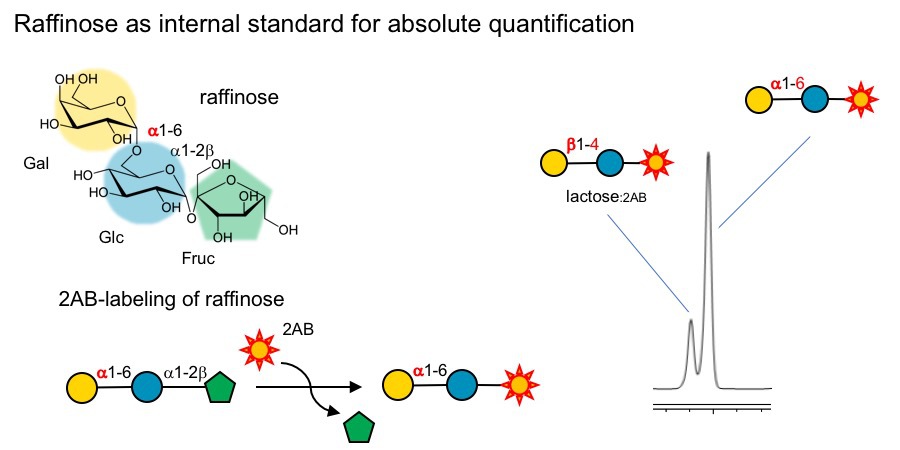
A: We use raffinose as an internal standard that is added to the milk samples before we start any processing or purification. Raffinose is an trisaccharide that behaves just like HMOs during the purification steps and allows us to track how much of the HMOs we lose during sample preparation, which is different from sample to sample, but very important to know if we want to compare HMO composition between samples.
Q: Why raffinose? 2-aminobenzamide (2AB) labels the reducing end of HMOs, but raffinose is not a reducing-end sugar. How does that work and why did you decide to use raffinose in the first place?
A: That's correct. Unlike HMOs, raffinose is not a reducing-end sugar. However, during the 2-AB-labeling process, fructose gets cleaved off from raffinose and the remaining disaccharide (Gal-Glc) gets labeled with 2AB and can be measured by HPLC-FL (see Figure below). This has at least three major advantages:(i) the now labeled disaccharide moves out of the HMO separation space without interfering with HMO resolution, and (ii) the Gal-Glc-disaccharide is distinct from lactose, does not interfere with the resolution of the lactose peak, and (iii) the Gal-alpha-1-6-Glc disaccharide contains a alpha-1-6-linkage that cannot be cleaved by lactase (beta-1-4-galactosidase), which we use to reduce lactose peak interfere.
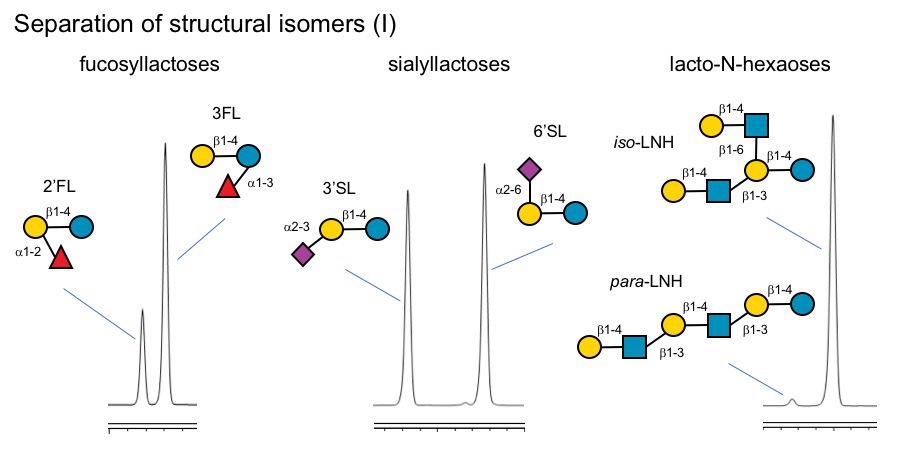
Q: Can your method distinguish between structural isomers like 2'-fucosyllactose (2'FL) and 3-fucosyllactose (3FL) or 6'-sialyllactose (3'SL) and 6'-sialyllactose (6'SL)?
A: Yes, we can easily distinguish between these structural isomers. In fact, they elute several minutes apart. We can also distinguish type-1 and type-2 isomers (LNT vs. LNnT) as well as iso- and para-forms (iso-LNH vs para-LNH).
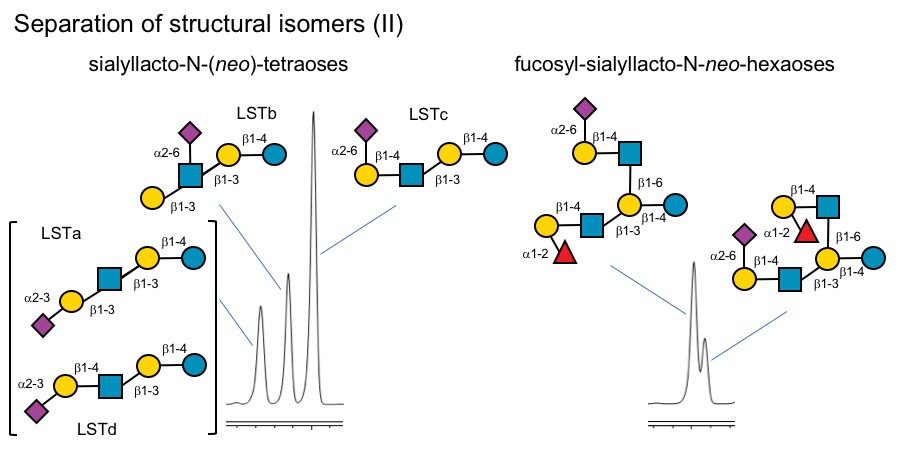
Q: How about larger and more complex HMOs? Can you separate those as well?
A: Yes, we can, but with limitations. For example, we can separate some of the LST isomers, but not all of them. LST b and LSTc clearly separate, but LSTa and LSTd elute at almost the same time. That's why we don't provide absolute quantification data for these two HMOs. However, we can separate structural isomers of fucosyl-siaylyllact-N-nei-hexaoses with reversed branches. - Complicated, but certainly possible.
Q: How many samples can you process? How long does it take to get results?
A: Our current capacity allows us to analyze ~300 samples per week. The turn-around time depends on how many other projects and samples are in the pipeline at a given time. Some projects receive priority status depending on deadlines for grant applications, manuscript submissions, etc.
Q: What is the largest sample set you have analyzed so far?
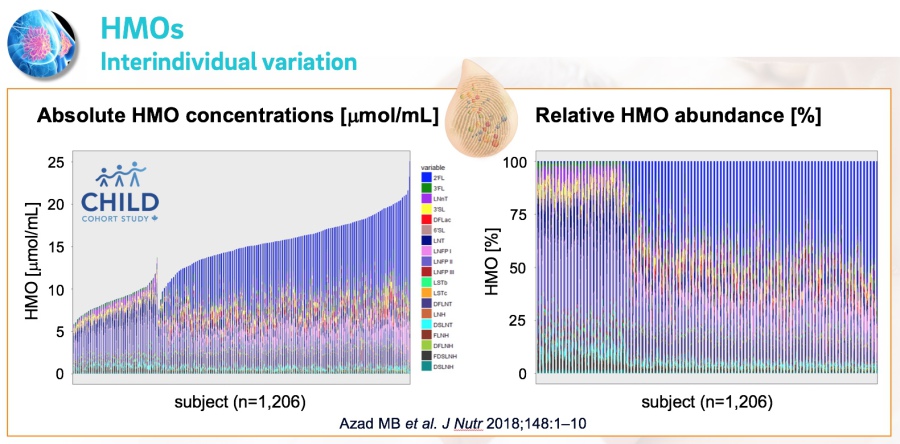
A: The largest sample size from a single cohort was around 2,000 milk samples. That was our own North-American NEC cohort. We recuited mothers and their very low birthweight infants from five different NICUs and analyzed milk samples to establish associations between HMOs and preterm infant risk to develop necrotizing enterocolitis. [Autran CA et al. Gut 2018; 67(6):1064-1070, PubMed]. The second largest sample size from a single cohort was around 1,200 samples from the CHILD study cohort (Figure below), followed by the Finnish STEPS cohort with slightly over 800 milk samples.
Q: How many samples have you analyzed so far and how does the data look like?
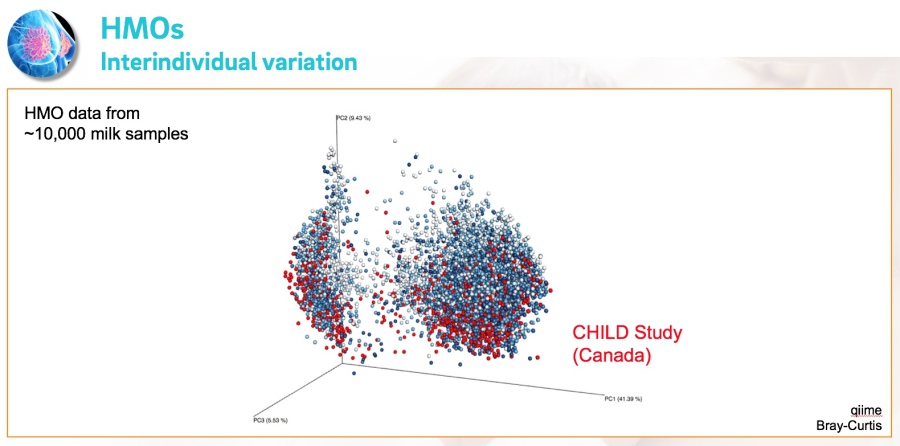
A: Over the past few years , we analyzed over 10,000 milk samples that were collected as part of a variety of studies from around the world. We combined all the datasets in one megadata collection for comparative analysis and the visual is just amazing!

Dedicated to Research on Human Milk Oligosaccharides